This text is machine-read, and may contain errors. Check the original document to verify accuracy.
FY2012 Revenue Source
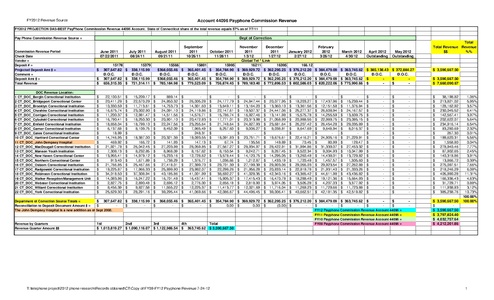
Account 44096 Payphone Commission Revenue
FY2012 PROJECTION DAS-BEST PayPhone Commisssion Revenue 44096 Account. State of Connecticut share of the total revenue equals 57% as of 7/7/11
Dept of Correction
Pay Phone Commission Revenue Source =
June 2011
07/22/2011
Commission Revenue Period
Check Date
Vendor =
Deposit # =
Projected Deposit Amt $ =
Comment =
Deposit Amt $ =
Total Revenue
$
$
DOC Revenue Location:
1 CT_DOC_Bergin Correctional Institution
2 CT_DOC_Bridgeport Correctional Center
3 CT_DOC_Brooklyn Correctional Institution
4 CT_DOC_Cheshire Correctional Institution
5 CT_DOC_Corrigan Correctional Institution
6 CT_DOC_Cybulski Correctional Institution
7 CT_DOC_Enfield Correctional Institution
8 CT_DOC_Garner Correctional Institution
9 CT_DOC_Gates Correctional Institution
10 CT_DOC_Hartford Correctional Center
11 CT_DOC_John Dempsey Hospital
12 CT_DOC_MacDougall Correctional Institution
13 CT_DOC_Manson Youth Institution
14 CT_DOC_New Haven Correctional Center
15 CT_DOC_Northern Correctional Center
16 CT_DOC_Osborn Correctional Institution
17 CT_DOC_Radgowski Correctional Institution
18 CT_DOC_Robinson Correctional Institution
19 CT_DOC_Walker Reception/Management Unit
20 CT_DOC_Webster Correctional Institution
21 CT_DOC_Willard Correctional Institution
22 CT_DOC_York Correctional Institution
$
$
$
$
$
$
$
$
$
$
$
$
$
$
$
$
$
$
$
$
$
$
$
July 2011
08/24/11
15178
307,647.82 $
D.O.C.
307,647.82 $
656,315.35 $
22,100.51
20,411.28
10,330.59
16,675.74
11,200.37
16,790.41
18,658.04
6,137.68
18.99
14,746.95
469.92
21,921.78
7,308.13
13,955.41
913.40
21,766.85
19,225.87
34,018.50
14,083.96
2,827.75
8,456.39
25,629.30
$
$
$
$
$
$
$
$
$
$
$
$
$
$
$
$
$
$
$
$
$
$
Department of Correction Source Totals =
$ 307,647.82
Reconciliation to Deposit Document Amount $ =
$
The John Dempsey Hospital is a new addition as of Sept 2008.
$
$
Revenue by Quarters
Revenue Quarter Amount $$
September
2011
10/26/11
August 2011
09/21/11
15379
15566
338,115.99
$368,055.46 $
D.O.C.
D.O.C.
338,115.99
$368,055.46 $
721,314.11 $ 785,184.98 $
15,209.17
22,570.29
11,713.61
23,002.90
12,981.47
18,250.30
18,799.10
8,109.75
18,387.00
166.72
26,042.45
8,232.85
14,979.12
1,671.89
25,467.66
17,966.33
37,308.94
16,247.22
2,890.48
9,827.58
28,291.16
$
$
$
$
$
$
$
$
$
$
$
$
$
$
$
$
$
$
$
$
$
$
338,115.99 $
$
889.14
24,850.32
14,753.73
24,091.10
14,511.56
20,901.10
22,247.56
8,452.09
20,321.38
141.93
27,203.98
8,968.09
15,233.16
1,738.29
27,418.01
25,899.90
40,185.86
16,701.48
2,696.12
11,555.22
39,295.44
$
$
$
$
$
$
$
$
$
$
$
$
$
$
$
$
$
$
$
$
$
$
368,055.46 $
$
October 2011
11/28/11
15801
365,401.45 $
D.O.C.
365,401.45 $
779,523.09 $
26,005.28
14,301.60
24,119.86
14,576.71
20,472.83
23,255.64
7,965.49
248.31
19,093.55
147.13
28,059.85
8,157.62
12,728.62
1,376.77
27,399.70
23,982.07
41,001.99
16,437.41
2,776.00
12,225.37
41,069.66
$
$
$
$
$
$
$
$
$
$
$
$
$
$
$
$
$
$
$
$
$
$
365,401.45 $
$
15995
354,784.90
D.O.C.
354,784.90
756,874.45
24,177.79
13,649.11
22,147.61
15,786.74
17,771.01
21,748.64
8,257.60
18,091.83
67.74
27,567.27
8,150.54
13,578.44
1,036.66
29,701.39
22,298.26
38,692.27
15,905.37
2,656.18
11,413.77
42,086.67
$
$
$
$
$
$
$
$
$
$
$
$
$
$
$
$
$
$
$
$
$
$
24,847.44
13,164.20
19,507.37
16,927.46
20,313.98
24,827.93
9,006.27
20,751.71
135.56
28,934.97
9,242.71
14,120.75
1,212.87
27,199.39
21,956.28
41,028.35
17,415.43
2,818.90
12,021.69
44,496.45
$
$
$
$
$
$
$
$
$
$
$
$
$
$
$
$
$
$
$
$
$
$
20,077.95
13,360.10
24,447.06
13,141.98
21,058.99
23,681.64
9,038.81
19,676.61
149.89
28,422.91
9,267.45
14,295.05
1,433.19
29,903.06
20,833.14
42,340.16
16,470.78
3,974.05
11,716.04
39,006.41
February
2012
3/26/12
January 2012
2/27/12
March 2012
4/30/12
April 2012
Outstanding
May 2012
Outstanding
Total
Total Revenue Revenue
$$
%%
166.12
$ 376,212.20 $ 384,479.09 $ 363,745.62 $ 385,138.43 $ 372,884.27
D.O.C.
D.O.C.
D.O.C.
D.O.C.
D.O.C.
$ 376,212.20 $ 384,479.09 $ 363,745.62 $
$
$ 802,586.03 $ 820,222.06 $ 775,990.66 $
$
-
$ 3,590,667.50
$ 7,660,090.67
$
$
$
$
$
$
$
$
$
$
$
$
$
$
$
$
$
$
$
$
$
$
18,203.27
13,361.56
25,277.37
15,575.78
20,988.55
26,207.42
8,647.69
22,416.21
70.45
31,994.86
9,522.34
13,260.48
1,720.48
29,055.03
22,819.78
43,365.42
18,288.49
3,505.28
11,269.23
40,662.51
$
$
$
$
$
$
$
$
$
$
$
$
$
$
$
$
$
$
$
$
$
$
17,437.96
12,151.58
26,608.94
14,255.59
22,989.75
26,454.28
9,648.94
24,905.16
80.99
31,339.07
9,004.93
14,438.01
1,457.57
29,923.54
21,931.40
44,611.98
19,121.36
4,207.03
11,729.66
42,181.35
$
$
$
$
$
$
$
$
$
$
$
$
$
$
$
$
$
$
$
$
$
$
15,239.44
11,376.84
24,167.57
13,609.75
23,085.15
29,035.89
8,016.37
21,229.91
128.47
27,453.32
10,047.99
13,729.82
1,305.60
27,262.88
21,333.26
43,436.82
15,664.93
3,377.92
11,723.88
42,519.82
$ 3,590,667.50
$
$
$
$
$
$
$
$
$
$
$
$
$
$
$
$
$
$
$
$
$
$
-
$
$
$
$
$
$
$
$
$
$
$
$
$
$
$
$
$
$
$
$
$
$
-
$
$
$
$
$
$
$
$
$
$
$
$
$
$
$
$
$
$
$
$
$
$
38,198.82
213,821.02
128,162.92
230,045.52
142,567.41
202,622.07
234,916.14
83,280.69
267.30
199,620.31
1,558.80
278,940.46
87,902.65
140,318.86
13,866.72
275,097.51
218,246.29
405,990.28
166,336.43
31,729.71
111,938.83
385,238.76
354,784.90 $ 369,929.72 $ 362,295.25 $ 376,212.20 $ 384,479.09 $ 363,745.62 $
0.00 $
0.00 $
(0.00) $
$
$
$
-
$
$
-
$
$
$
$
$
$
3,590,667.50
3,590,667.50
3,797,824.40
4,032,757.64
4,212,201.86
1st
2nd
3rd
4th
Total
$ 1,013,819.27 $ 1,090,116.07 $ 1,122,986.54 $ 363,745.62 $ 3,590,667.50
T:\telephone project\2012 phone research\Records obtained\CT\Copy of FY09-FY12 Payphone Revenue 7-24-12
November
December
2011
2011
1/3/12
1/27/12
Global Tel * Link
16211
16395
$ 369,929.72 $ 362,295.25
D.O.C.
D.O.C.
$ 369,929.72 $ 362,295.25
$ 789,183.40 $ 772,896.53
FY12 Payphone Commission Revenue Account 44096 =
FY11 Payphone Commission Revenue Account 44096 =
FY10 Payphone Commission Revenue Account 44096 =
FY09 Payphone Commission Revenue Account 44096 =
1.06%
5.95%
3.57%
6.41%
3.97%
5.64%
6.54%
2.32%
0.01%
5.56%
0.04%
7.77%
2.45%
3.91%
0.39%
7.66%
6.08%
11.31%
4.63%
0.88%
3.12%
10.73%
100.00%
100.00%
1